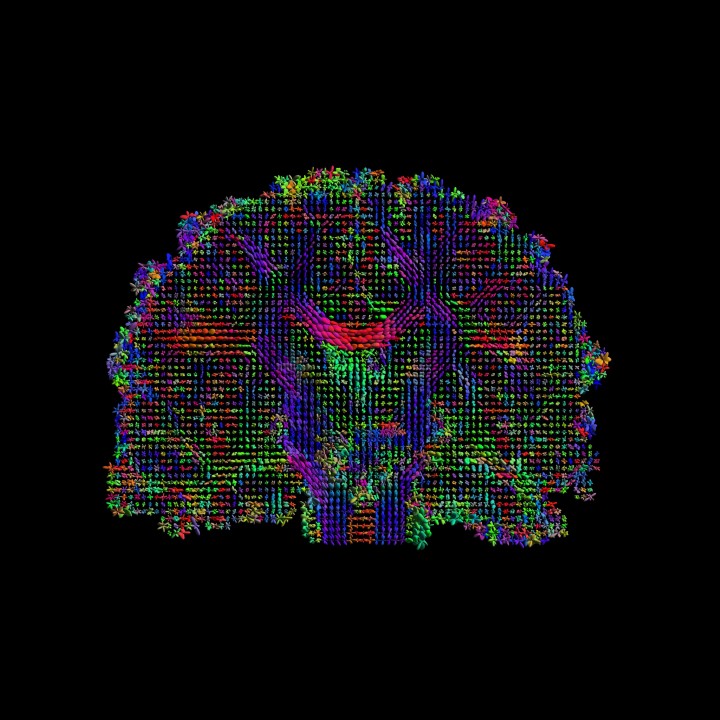
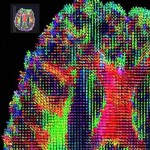
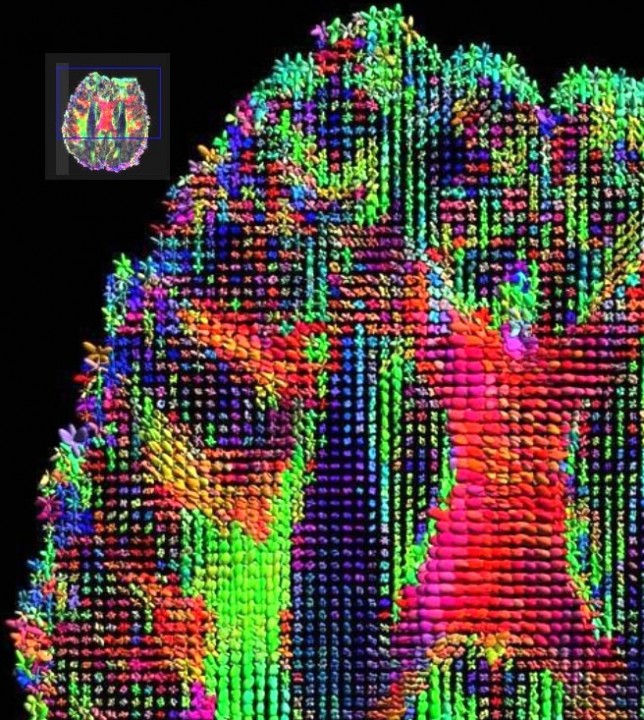
A coronal slice of a diffusion tensor imaging data, each pixel is represented with an ellipsoid glyph depicting water molecule diffusion. Alternate: HARDI (high-angular resolution diffusion imaging), Coronal view. The tensor can be visualized as an ellipsoid in 3D space, showing fluid mappings and brain connectivity. Image by David Shattuck, PhD. and Paul M. Thompson, PhD. HARDI (high-angular resolution diffusion imaging), Coronal view. The tensor can be visualized as an ellipsoid in 3D space, showing fluid mappings and brain connectivity. Image by David Shattuck, PhD. and Paul M. Thompson, PhD.
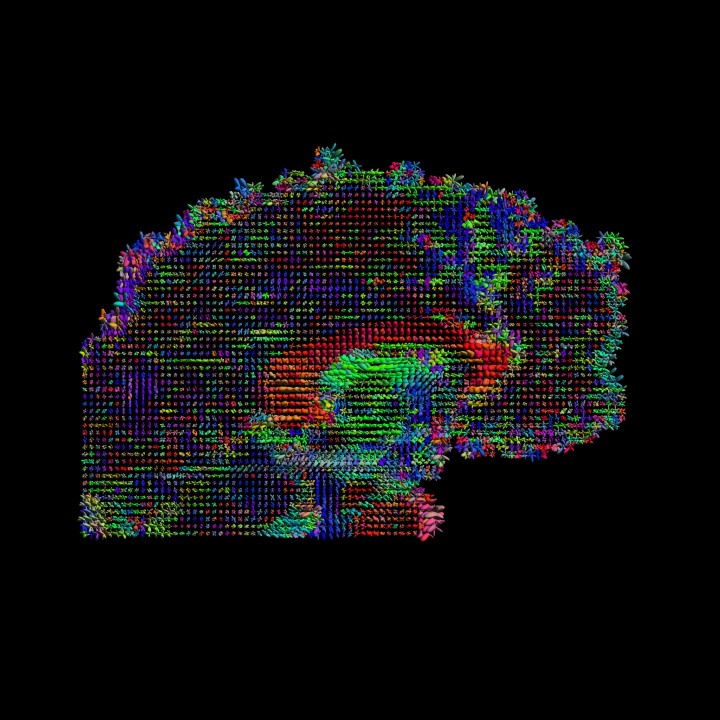
A sagittal slice of a diffusion tensor imaging data, each pixel is represented with an ellipsoid glyph depicting water molecule diffusion. Alternate: HARDI (high-angular resolution diffusion imaging), Sagittal view. The tensor can be visualized as an ellipsoid in 3D space, showing fluid mappings and brain connectivity. Image by David Shattuck, PhD. and Paul M. Thompson, PhD. HARDI (high-angular resolution diffusion imaging), Saggital view. The tensor can be visualized as an ellipsoid in 3D space, showing fluid mappings and brain connectivity. Image by David Shattuck, PhD. and Paul M. Thompson, PhD.
An axial slice of a diffusion tensor imaging data, each pixel is represented with an ellipsoid glyph depicting water molecule diffusion. Alternate: HARDI (high-angular resolution diffusion imaging), Axial view.The tensor can be visualized as an ellipsoid in 3D space, showing fluid mappings and brain connectivity. Image by David Shattuck, PhD. and Paul M. Thompson, PhD HARDI (high-angular resolution diffusion imaging), Axial view.The tensor can be visualized as an ellipsoid in 3D space, showing fluid mappings and brain connectivity. Image by David Shattuck, PhD. and Paul M. Thompson, PhD.
An axial slice of a diffusion tensor imaging dataset set inside a brain surface. The coloring indicates the principal diffusion direction, with red going left-right, green going anterior posterior, and blue going inferior-superior. Alternate: The primary eigenvector of the diffusion tensor in these two axial slices indicates the fiber orientation at each voxel. A transparent brain surface rendering provides a sense of position and scale. Software: DIRAC. Image by Vishal Patel, PhD. The primary eigenvector of the diffusion tensor in these two axial slices indicates the fiber orientation at each voxel. A transparent brain surface rendering provides a sense of position and scale. Software: DIRAC. Image by Vishal Patel, PhD.
A detailed view of axial slice of a diffusion tensor imaging dataset. The coloring indicates the principal diffusion direction, with red going left-right, green going anterior posterior, and blue going inferior-superior. Alternate: The primary eigenvector of the diffusion tensor at each voxel indicates the orientation of the fibers at each point in these three axial slices. Software: DIRAC. Image by Vishal Patel, PhD. The primary eigenvector of the diffusion tensor at each voxel indicates the orientation of the fibers at each point in these three axial slices. Software: DIRAC. Image by Vishal Patel, PhD.
A detailed view of axial slice of a diffusion tensor imaging dataset. The coloring indicates the principal diffusion direction, with red going left-right, green going anterior posterior, and blue going inferior-superior. Alternate: A slice of diffusion tensor ellipsoids plotted over the fractional anisotropy image to illustrate fiber orientations throughout the brain. Software: DIRAC. Image by Vishal Patel, PhD. A slice of diffusion tensor ellipsoids plotted over the fractional anisotropy image to illustrate fiber orientations throughout the brain. Software: DIRAC. Image by Vishal Patel, PhD.
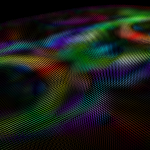
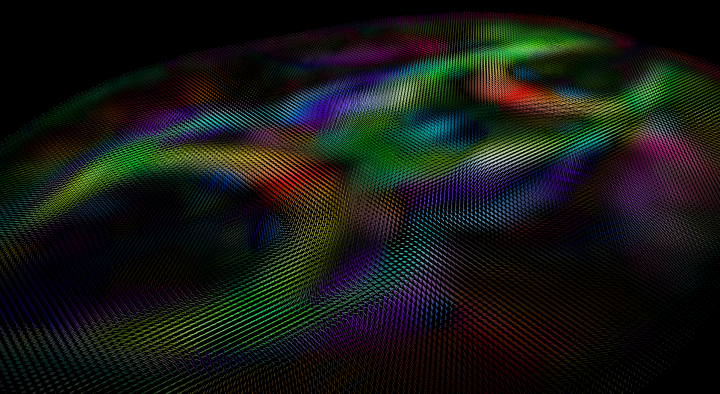
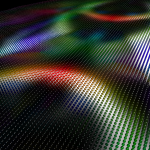
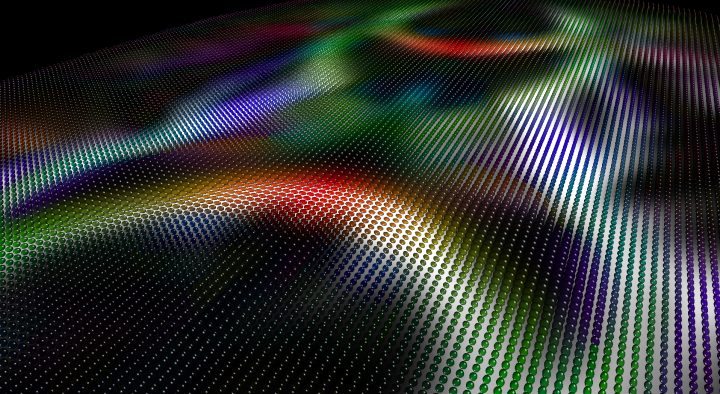
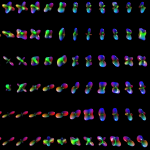
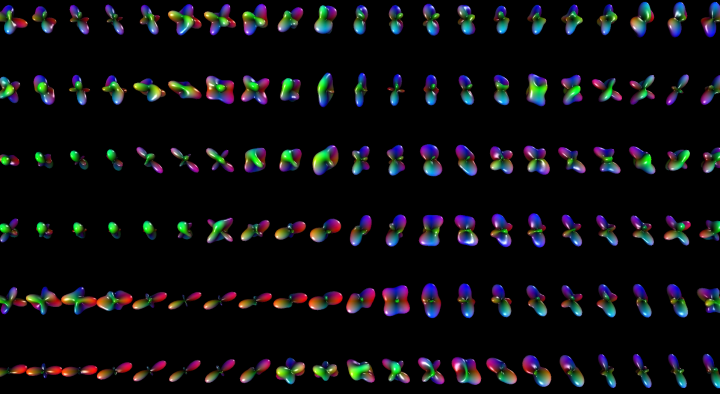
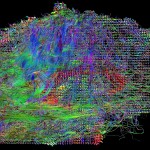
The orientation distribution function (ODF) computed in high angular resolution diffusion imaging (HARDI) provides for the presence of multiple fiber populations at each voxel. Software: DIRAC. Image by Vishal Patel, PhD. The orientation distribution function (ODF) computed in high angular resolution diffusion imaging (HARDI) provides for the presence of multiple fiber populations at each voxel. Software: DIRAC. Image by Vishal Patel, PhD.
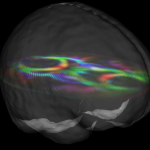
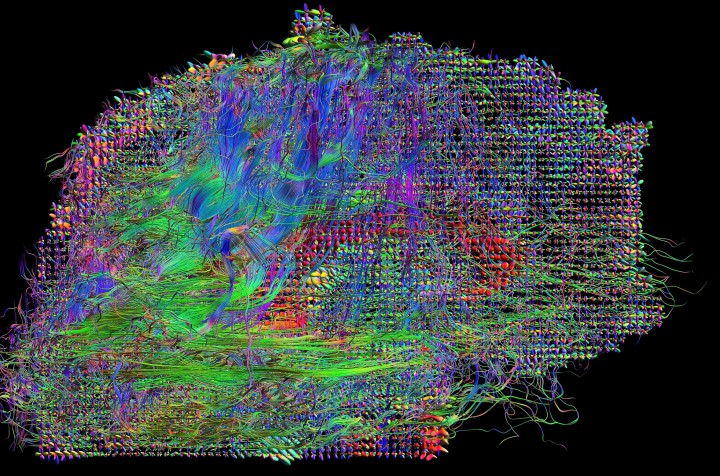
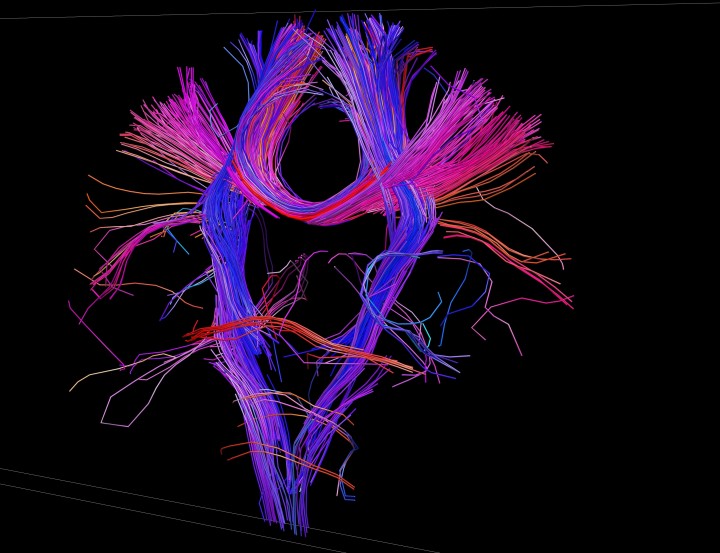
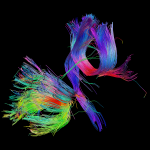
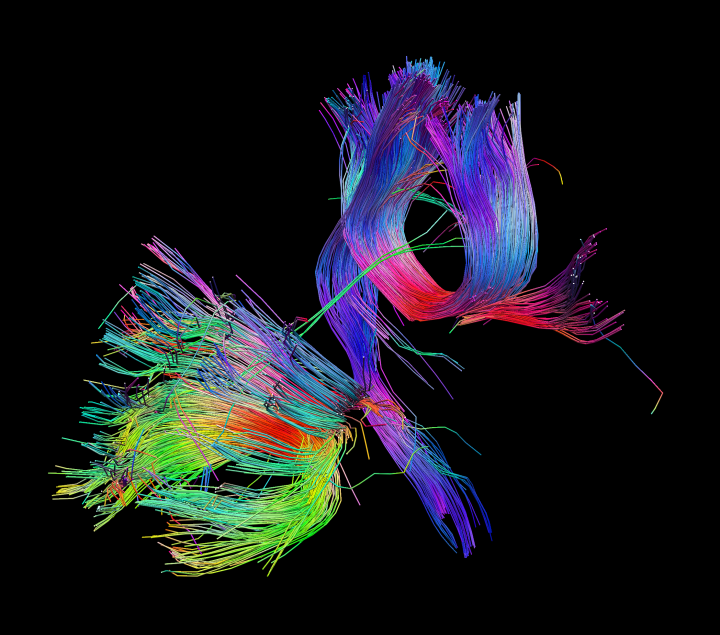
HARDI (high angular resolution diffusion imaging) tracks show aligned brain DTI data across subjects with a 3D fluid transformation, optimizing a measure based on information theory. Image by David Shattuck, PhD. and Paul M. Thompson, PhD. HARDI (high angular resolution diffusion imaging) tracks show aligned brain DTI data across subjects with a 3D fluid transformation, optimizing a measure based on information theory. Image by David Shattuck, PhD. and Paul M. Thompson, PhD.
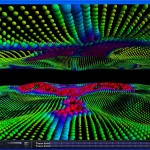
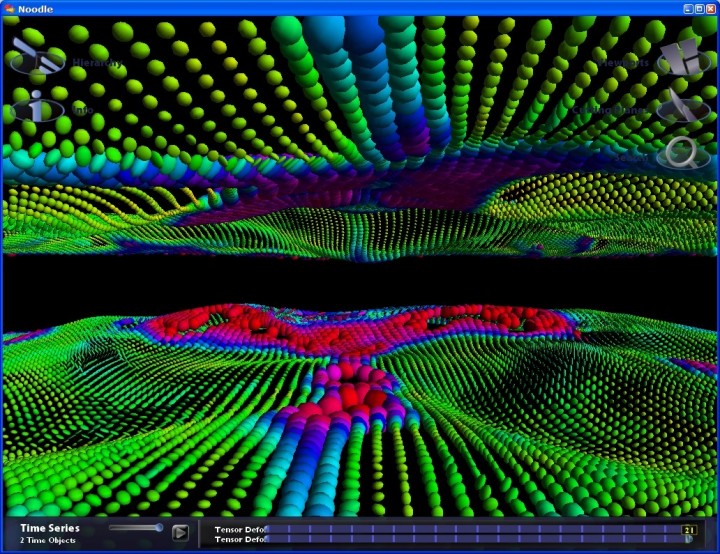
Diffusion Tensor Imaging Deformation. Ellipsoidal tensor glyphs visualize fluid registration. Image by David Shattuck, PhD. and Paul M. Thompson, PhD. Diffusion Tensor Imaging Deformation. Ellipsoidal tensor glyphs visualize fluid registration. Image by David Shattuck, PhD. and Paul M. Thompson, PhD.
DTI statistical segmentation shown with a 3D model of the ventricles DTI statistical segmentation using v different distribution. www.humanconnectomeproject.org
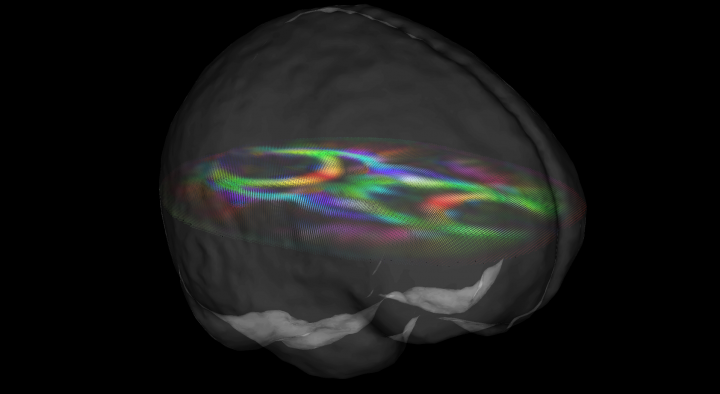
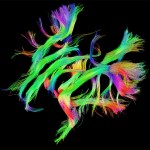
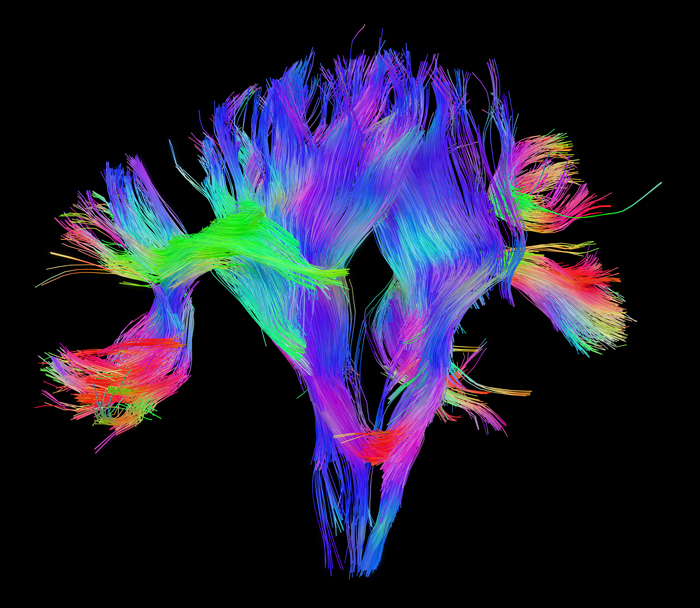
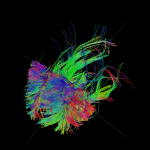
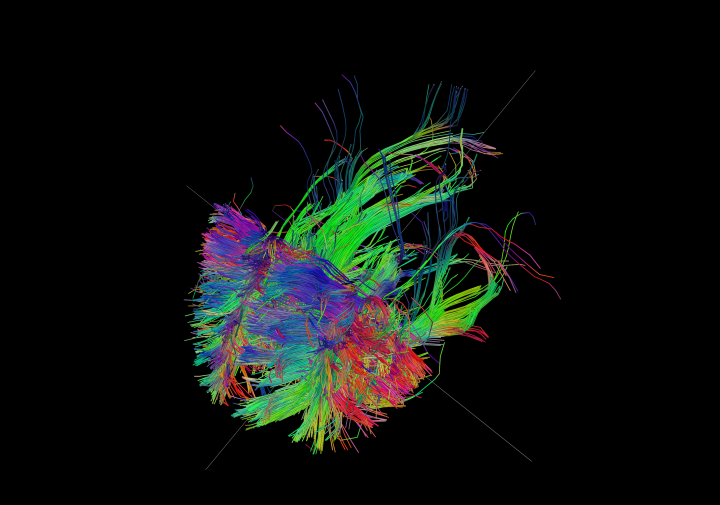
HARDI (high angular resolution diffusion imaging) tracks: Information transfer between left and right hemispheres. Image by David Shattuck, PhD. and Paul M. Thompson, PhD. HARDI (high angular resolution diffusion imaging) tracks: Information transfer between left and right hemispheres. Image by David Shattuck, PhD. and Paul M. Thompson, PhD.
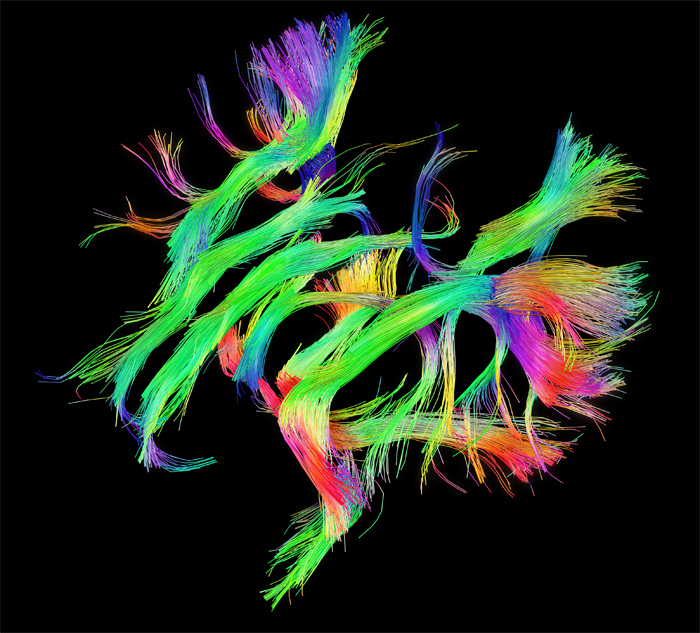
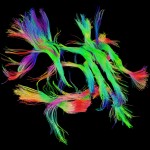
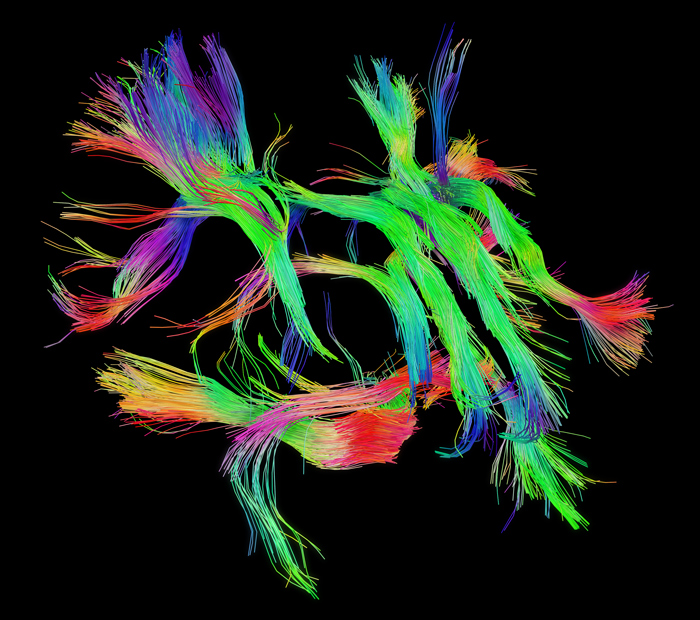
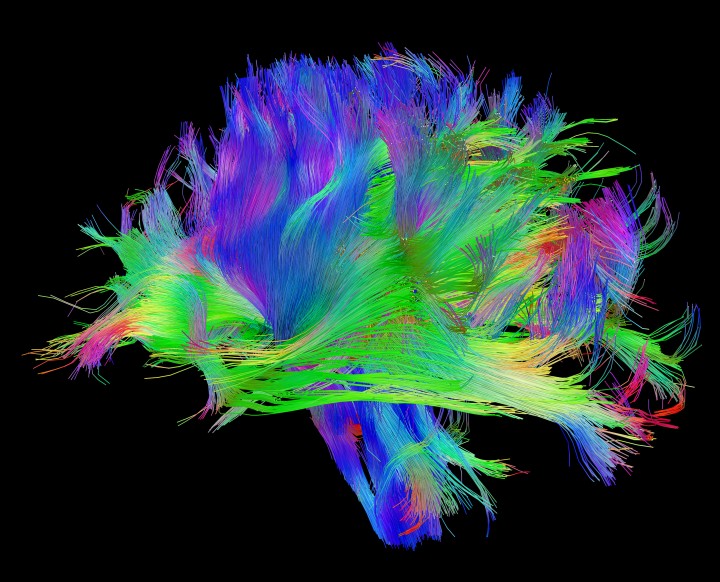
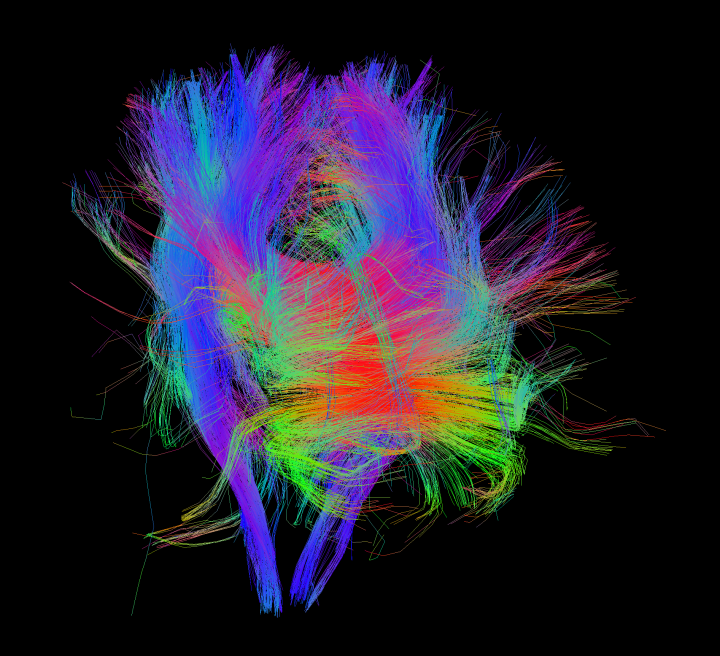
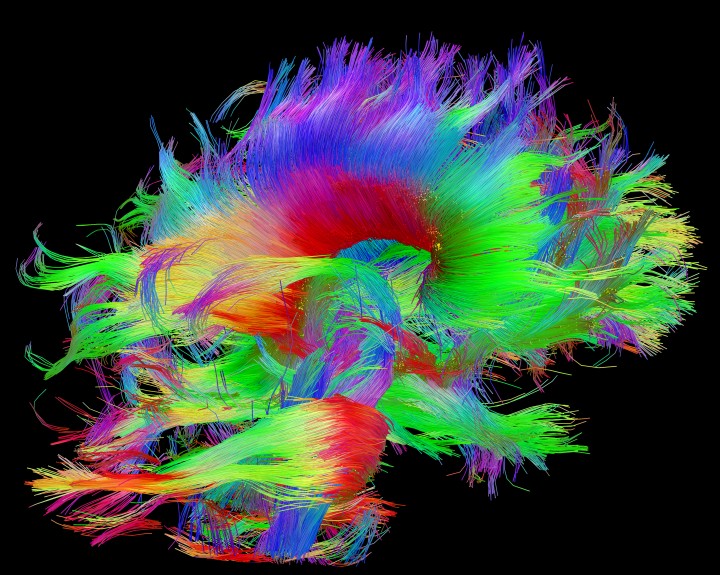
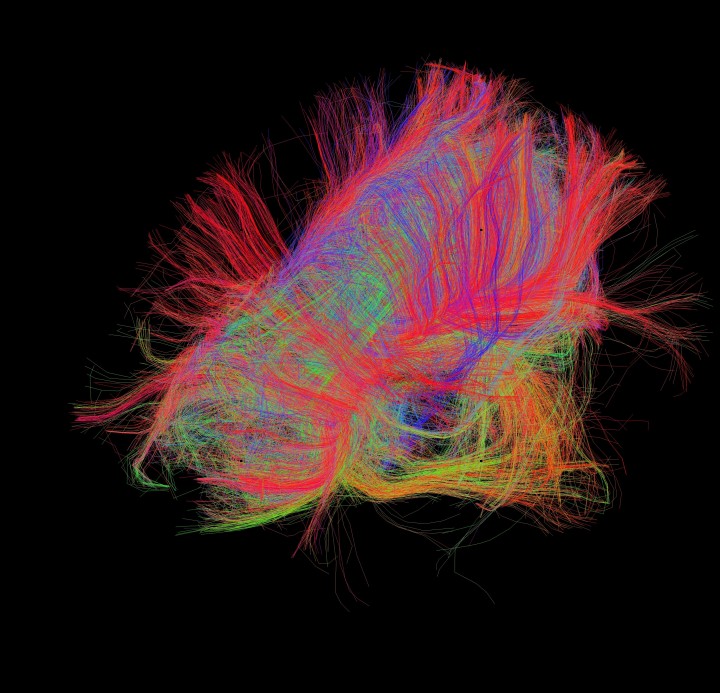
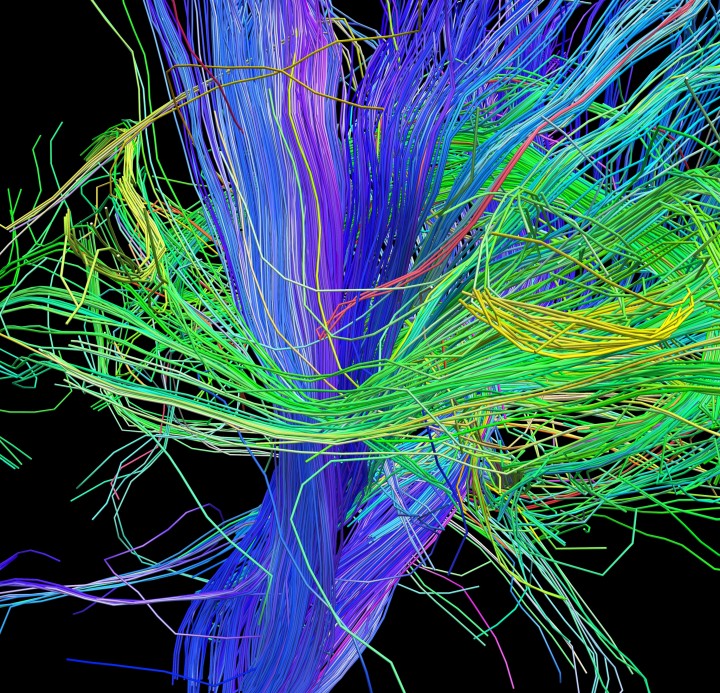
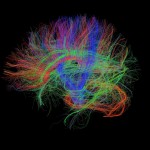
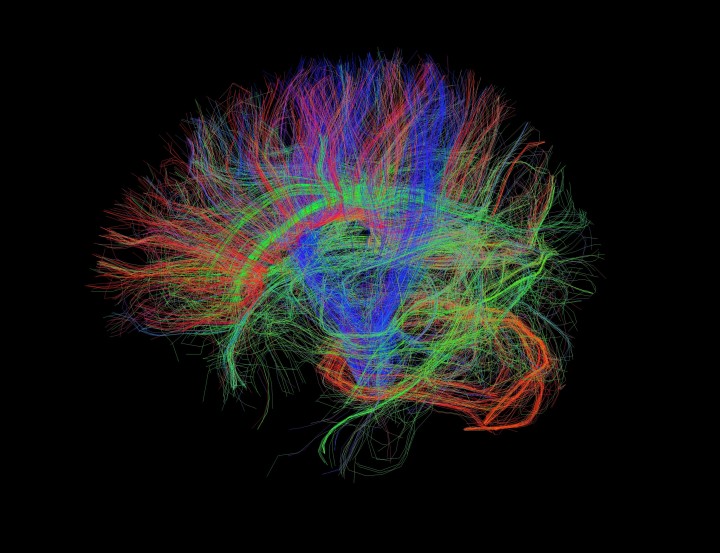
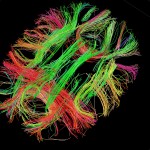
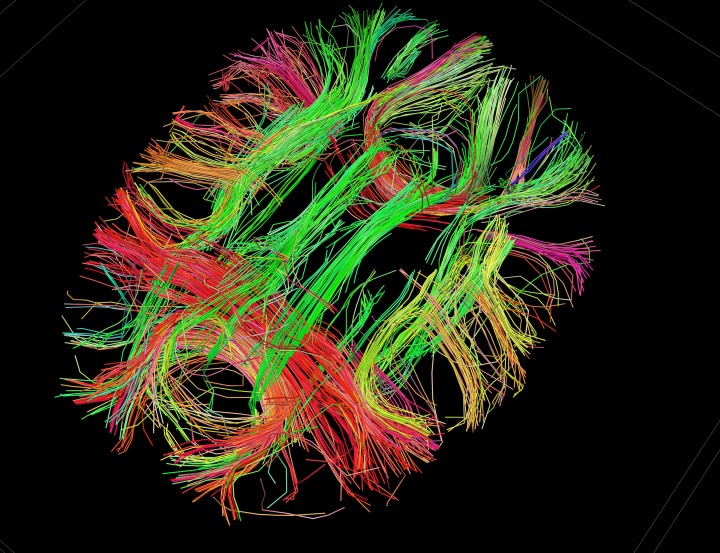
White matter fiber architecture from the Connectome Scanner dataset. Shown are association pathways connecting cortical areas. The fibers are color-coded by direction: red = left-right, green = anterior-posterior, blue = ascending-descending (RGB=XYZ). www.humanconnectomeproject.org White matter fiber architecture from the Connectome Scanner dataset. The fibers are color-coded by direction: red = left-right, green = anterior-posterior, blue = ascending-descending (RGB=XYZ). www.humanconnectomeproject.org
White matter fiber architecture from the Connectome Scanner dataset. Shown are association pathways connecting cortical areas. The fibers are color-coded by direction: red = left-right, green = anterior-posterior, blue = ascending-descending (RGB=XYZ). www.humanconnectomeproject.org White matter fiber architecture from the Connectome Scanner dataset. The fibers are color-coded by direction: red = left-right, green = anterior-posterior, blue = ascending-descending (RGB=XYZ). www.humanconnectomeproject.org
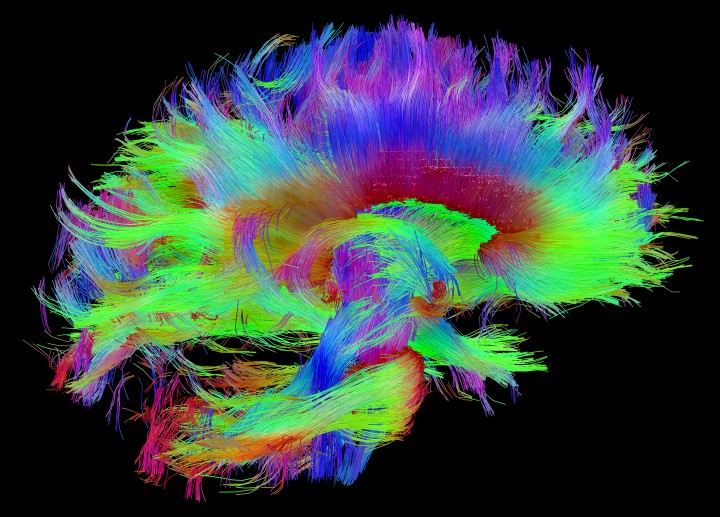
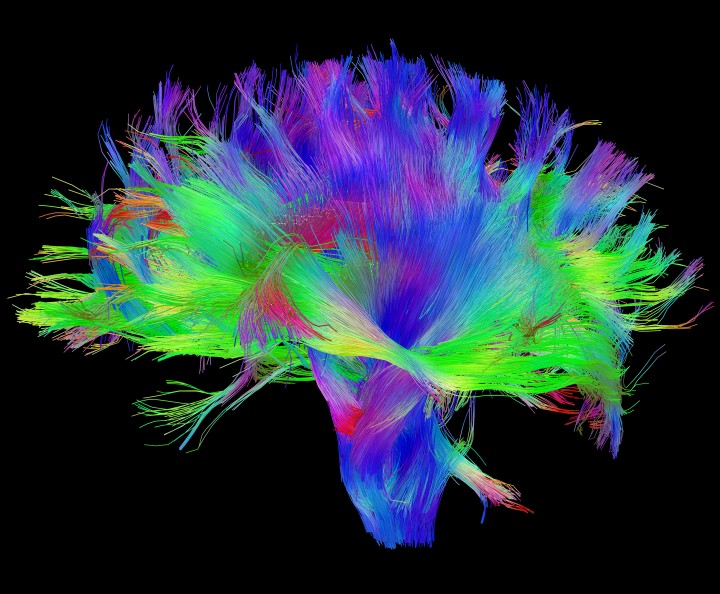
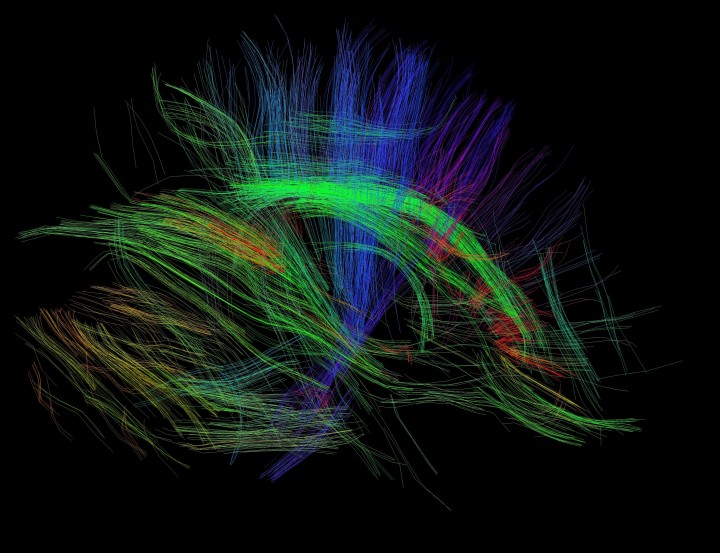
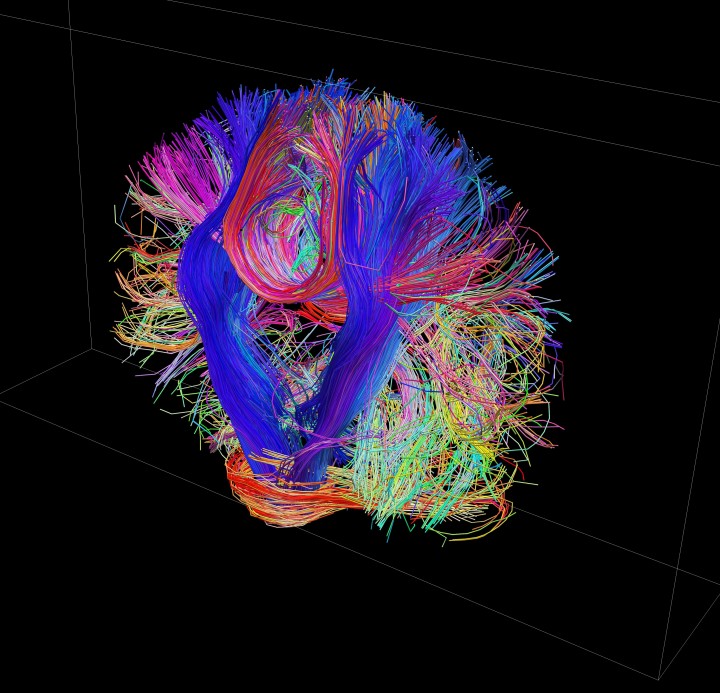
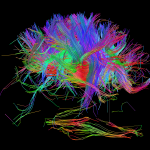
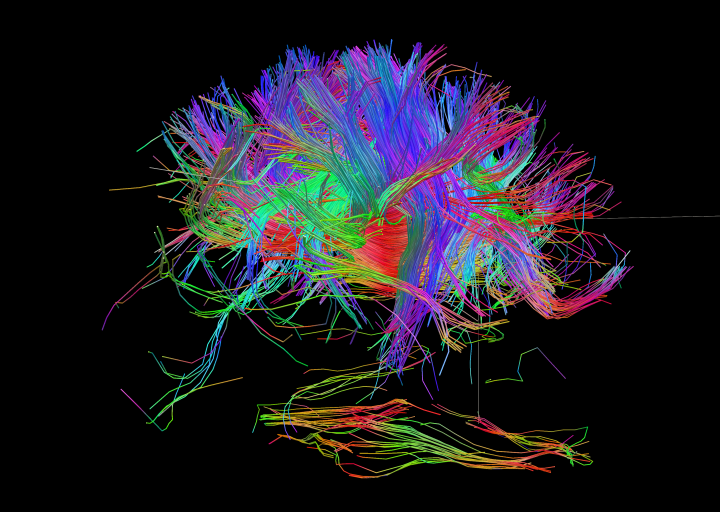
White matter fiber architecture from the Connectome Scanner dataset. Shown are projections from the brainstem to cortext and interhemispheric connections. The fibers are color-coded by direction: red = left-right, green = anterior-posterior, blue = ascending-descending (RGB=XYZ). www.humanconnectomeproject.org White matter fiber architecture from the Connectome Scanner dataset. The fibers are color-coded by direction: red = left-right, green = anterior-posterior, blue = ascending-descending (RGB=XYZ). www.humanconnectomeproject.org
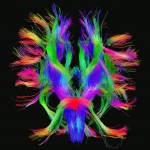
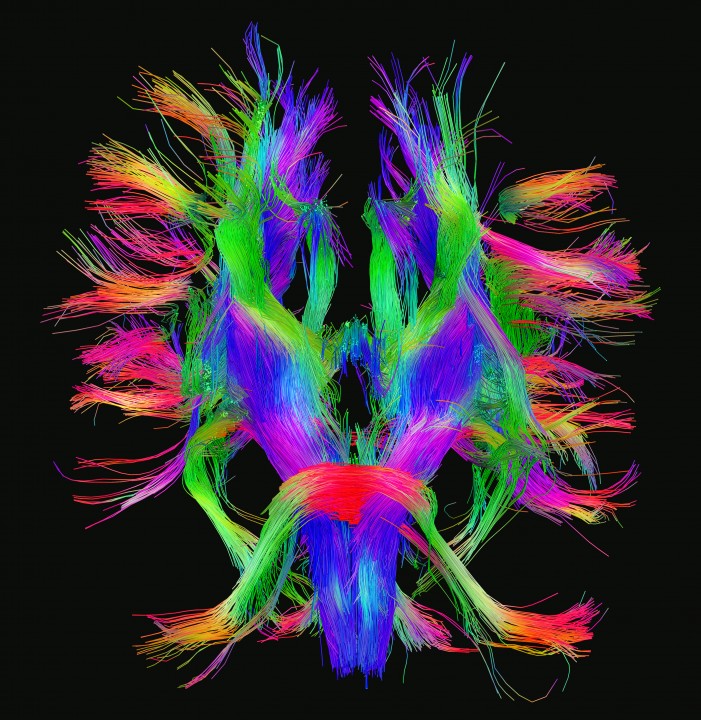
White matter fiber architecture from the Connectome Scanner dataset. Shown are commissural connections. The fibers are color-coded by direction: red = left-right, green = anterior-posterior, blue = ascending-descending (RGB=XYZ). www.humanconnectomeproject.org White matter fiber architecture from the Connectome Scanner dataset. The fibers are color-coded by direction: red = left-right, green = anterior-posterior, blue = ascending-descending (RGB=XYZ). www.humanconnectomeproject.org
White matter fiber architecture from the Connectome Scanner dataset. Shown are commissural connections. The fibers are color-coded by direction: red = left-right, green = anterior-posterior, blue = ascending-descending (RGB=XYZ). www.humanconnectomeproject.org White matter fiber architecture from the Connectome Scanner dataset. The fibers are color-coded by direction: red = left-right, green = anterior-posterior, blue = ascending-descending (RGB=XYZ). www.humanconnectomeproject.org
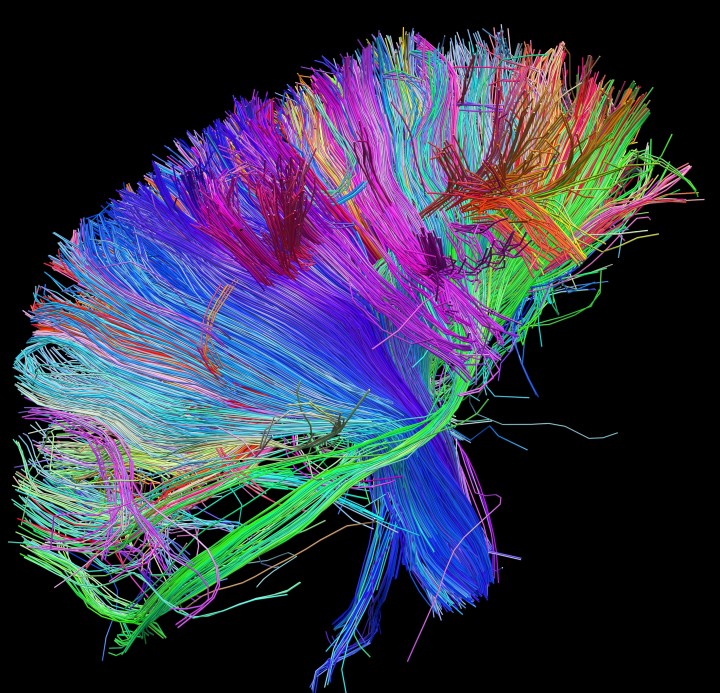
White matter fiber architecture from the Connectome Scanner dataset. Shown are the corona radiata and inferior fronto-occipital fasciculus. The fibers are color-coded by direction: red = left-right, green = anterior-posterior, blue = ascending-descending (RGB=XYZ). www.humanconnectomeproject.org White matter fiber architecture from the Connectome Scanner dataset. The fibers are color-coded by direction: red = left-right, green = anterior-posterior, blue = ascending-descending (RGB=XYZ). www.humanconnectomeproject.org
White matter fiber architecture from the Connectome Scanner dataset. Shown are the corpus calllosum and brainstem pathways. The fibers are color-coded by direction: red = left-right, green = anterior-posterior, blue = ascending-descending (RGB=XYZ). www.humanconnectomeproject.org White matter fiber architecture from the Connectome Scanner dataset. The fibers are color-coded by direction: red = left-right, green = anterior-posterior, blue = ascending-descending (RGB=XYZ). www.humanconnectomeproject.org
White matter fiber architecture of the brain. Measured from diffusion spectrum imaging (DSI). Shown are brainstem projections to cortex and the corpus callosum. The fibers are color-coded by direction: red = left-right, green = anterior-posterior, blue = through brain stem. www.humanconnectomeproject.org White matter fiber architecture of the brain. Measured from diffusion spectral imaging (DSI). The fibers are color-coded by direction: red = left-right, green = anterior-posterior, blue = through brain stem. www.humanconnectomeproject.org
White matter fiber architecture of the brain. Measured from diffusion spectrum imaging (DSI). Shown are the corona radiata and external capsule. The fibers are color-coded by direction: red = left-right, green = anterior-posterior, blue = through brain stem. www.humanconnectomeproject.org White matter fiber architecture of the brain. Measured from diffusion spectral imaging (DSI). The fibers are color-coded by direction: red = left-right, green = anterior-posterior, blue = up-down. www.humanconnectomeproject.org
White matter fiber architecture of the brain. Measured from diffusion spectrum imaging (DSI). Shown are the corpus calllosum and brainstem pathways. The fibers are color-coded by direction: red = left-right, green = anterior-posterior, blue = ascending-descending (RGB=XYZ). www.humanconnectomeproject.org White matter fiber architecture of the brain. Measured from diffusion spectral imaging (DSI). The fibers are color-coded by direction: red = left-right, green = anterior-posterior, blue = up-down. www.humanconnectomeproject.org
White matter fiber architecture of the brain. Measured from diffusion spectrum imaging (DSI). Shown are the corona radiata and external capsule. The fibers are color-coded by direction: red = left-right, green = anterior-posterior, blue = through brain stem. www.humanconnectomeproject.org White matter fiber architecture of the brain. Measured from diffusion spectral imaging (DSI). The fibers are color-coded by direction: red = left-right, green = anterior-posterior, blue = through brain stem. www.humanconnectomeproject.org
White matter fiber architecture of the brain. Measured from spectrum imaging (DSI). Shown is the corpus cdiffusionallosum. The fibers are color-coded by direction: red = left-right, green = anterior-posterior, blue = through brain stem. www.humanconnectomeproject.org White matter fiber architecture of the brain. Measured from diffusion spectral imaging (DSI). The fibers are color-coded by direction: red = left-right, green = anterior-posterior, blue = through brain stem. www.humanconnectomeproject.org
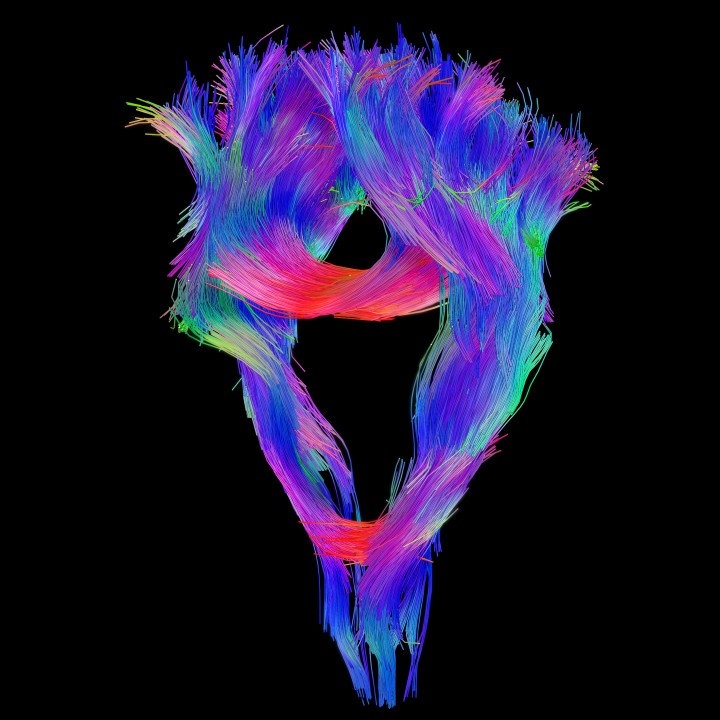
White matter fiber architecture of the brain. Measured from diffusion spectrum imaging (DSI). Shown is a thick coronal section of tracks through the corticospinal tract. The fibers are color-coded by direction: red = left-right, green = anterior-posterior, blue = through brain stem. www.humanconnectomeproject.org White matter fiber architecture of the brain. Measured from diffusion spectral imaging (DSI). The fibers are color-coded by direction: red = left-right, green = anterior-posterior, blue = through brain stem. www.humanconnectomeproject.org
White matter fiber architecture of the brain. Measured from diffusion spectrum imaging (DSI). Shown are fibers from the internal and external capsule. The fibers are color-coded by direction: red = left-right, green = anterior-posterior, blue = through brain stem. www.humanconnectomeproject.org White matter fiber architecture of the brain. Measured from diffusion spectral imaging (DSI). The fibers are color-coded by direction: red = left-right, green = anterior-posterior, blue = through brain stem. www.humanconnectomeproject.org
White matter fiber architecture of the brain. Measured from diffusion spectrum imaging (DSI). Shown is a thick coronal section of tracks through the corticospinal tract. The fibers are color-coded by direction: red = left-right, green = anterior-posterior, blue = through brain stem. www.humanconnectomeproject.org White matter fiber architecture of the brain. Measured from diffusion spectral imaging (DSI). The fibers are color-coded by direction: red = left-right, green = anterior-posterior, blue = through brain stem. www.humanconnectomeproject.org
White matter fiber architecture of the brain. Measured from diffusion spectrum imaging (DSI). Featured on the cover of he 2nd Law by the band Muse. The fibers are color-coded by direction: red = left-right, green = anterior-posterior, blue = through brain stem. www.humanconnectomeproject.org White matter fiber architecture of the brain. Measured from diffusion spectral imaging (DSI). The fibers are color-coded by direction: red = left-right, green = anterior-posterior, blue = up-down. www.humanconnectomeproject.org
White matter fiber architecture of the brain. Measured from diffusion spectrum imaging (DSI). Shown are association and projection fibers. The fibers are color-coded by direction: red = left-right, green = anterior-posterior, blue = through brain stem. www.humanconnectomeproject.org White matter fiber architecture from the Connectome Scanner dataset. The fibers are color-coded by direction: red = left-right, green = anterior-posterior, blue = ascending-descending (RGB=XYZ). www.humanconnectomeproject.org
White matter fiber architecture of the brain. Measured from diffusion spectrum imaging (DSI). Shown are crossing fibers from the corpus callosum and corticospinal tract. The fibers are color-coded by direction: red = left-right, green = anterior-posterior, blue = through brain stem. www.humanconnectomeproject.org White matter fiber architecture of the brain. Measured from diffusion spectral imaging (DSI). The fibers are color-coded by direction: red = left-right, green = anterior-posterior, blue = through brain stem. www.humanconnectomeproject.org
White matter fiber architecture of the brain. Measured from diffusion spectrum imaging (DSI). Shown is a complex combination of brainstem pathways, thalamic radiation, and short association fibers. The fibers are color-coded by direction: red = left-right, green = anterior-posterior, blue = through brain stem. www.humanconnectomeproject.org White matter fiber architecture of the brain. Measured from diffusion spectral imaging (DSI). The fibers are color-coded by direction: red = left-right, green = anterior-posterior, blue = up-down. www.humanconnectomeproject.org
White matter fiber architecture of the brain. Measured from diffusion spectrum imaging (DSI). Shown are the corpus callosum, cerebellum, and others. The fibers are color-coded by direction: red = left-right, green = anterior-posterior, blue = through brain stem. www.humanconnectomeproject.org White matter fiber architecture of the brain. Measured from diffusion spectral imaging (DSI). The fibers are color-coded by direction: red = left-right, green = anterior-posterior, blue = through brain stem. www.humanconnectomeproject.org
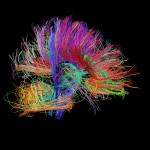
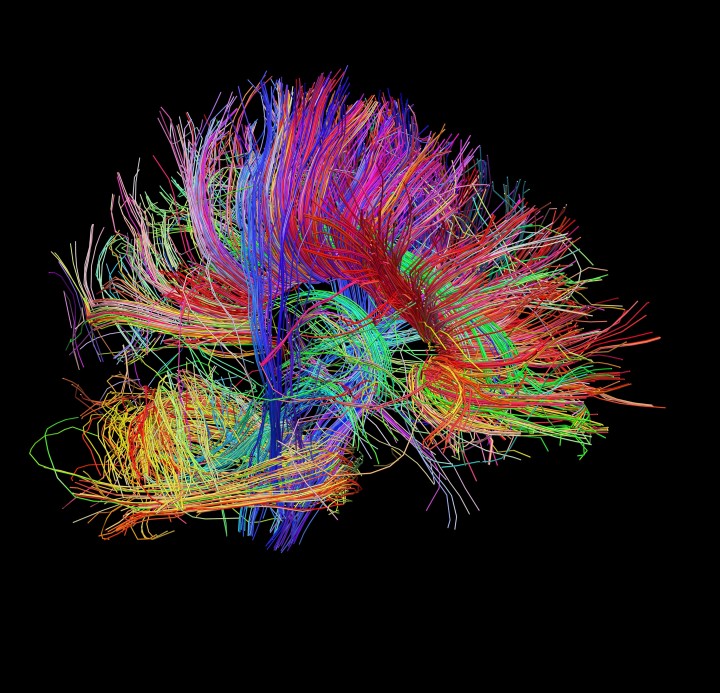
White matter fiber architecture of the brain. Measured from diffusion spectrum imaging (DSI). Shown are whole brain fibers. The fibers are color-coded by direction: red = left-right, green = anterior-posterior, blue = through brain stem. www.humanconnectomeproject.org White matter fiber architecture of the brain. Measured from diffusion spectral imaging (DSI). The fibers are color-coded by direction: red = left-right, green = anterior-posterior, blue = through brain stem. www.humanconnectomeproject.org
White matter fiber architecture of the brain. Measured from diffusion spectrum imaging (DSI). Shown in a detailed view of subcortical fibers. The fibers are color-coded by direction: red = left-right, green = anterior-posterior, blue = through brain stem. www.humanconnectomeproject.org White matter fiber architecture of the brain. Measured from diffusion spectral imaging (DSI). The fibers are color-coded by direction: red = left-right, green = anterior-posterior, blue = through brain stem. www.humanconnectomeproject.org
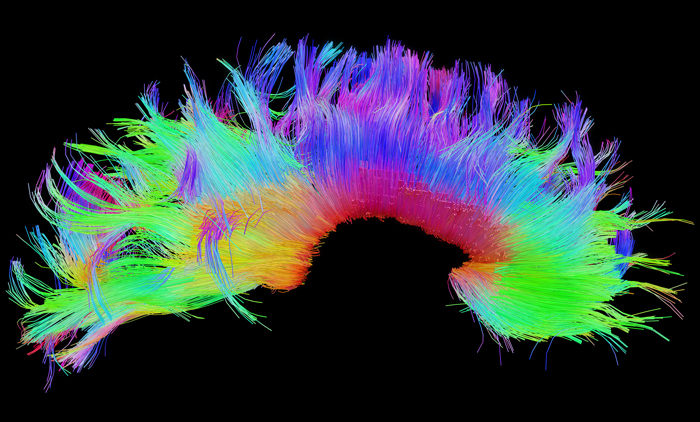
White matter fiber architecture of the brain. Measured from diffusion spectrum imaging (DSI). Shown is a thick axial section including the cingulum, forceps, and short association pathways. The fibers are color-coded by direction: red = left-right, green = anterior-posterior, blue = through brain stem. www.humanconnectomeproject.org White matter fiber architecture of the brain. Measured from diffusion spectral imaging (DSI). The fibers are color-coded by direction: red = left-right, green = anterior-posterior, blue = through brain stem. www.humanconnectomeproject.org
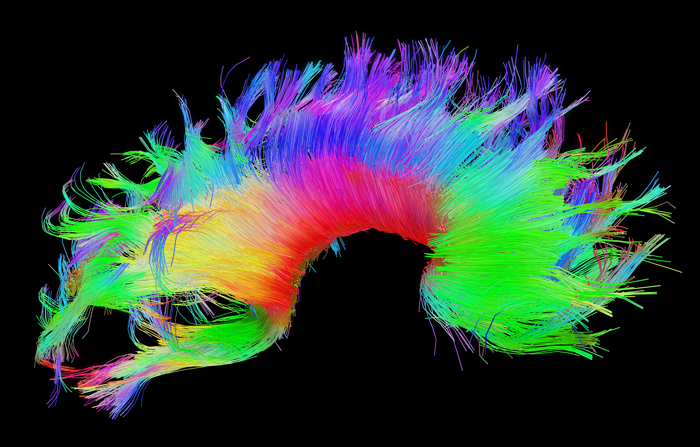
White matter fiber architecture of the brain. Measured from diffusion spectrum imaging (DSI). Shown is the cingulum bundle resting atop the corpus callosum. The fibers are color-coded by direction: red = left-right, green = anterior-posterior, blue = through brain stem. www.humanconnectomeproject.org White matter fiber architecture of the brain. Measured from diffusion spectral imaging (DSI). The fibers are color-coded by direction: red = left-right, green = anterior-posterior, blue = through brain stem. www.humanconnectomeproject.org
White matter fiber architecture of the brain. Measured from diffusion spectrum imaging (DSI). Shown are frontal projection fibers including the cingulum, anterior thalamic radiation, and forceps minor. The fibers are color-coded by direction: red = left-right, green = anterior-posterior, blue = through brain stem. www.humanconnectomeproject.org White matter fiber architecture of the brain. Measured from diffusion spectral imaging (DSI). The fibers are color-coded by direction: red = left-right, green = anterior-posterior, blue = through brain stem. www.humanconnectomeproject.org
White matter fiber architecture of the brain. Measured from diffusion spectrum imaging (DSI). Shown are the forceps minor, corpus callosum, and a brainstem projection. The fibers are color-coded by direction: red = left-right, green = anterior-posterior, blue = through brain stem. www.humanconnectomeproject.org White matter fiber architecture of the brain. Measured from diffusion spectral imaging (DSI). The fibers are color-coded by direction: red = left-right, green = anterior-posterior, blue = through brain stem. www.humanconnectomeproject.org
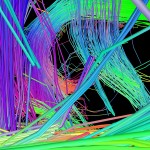
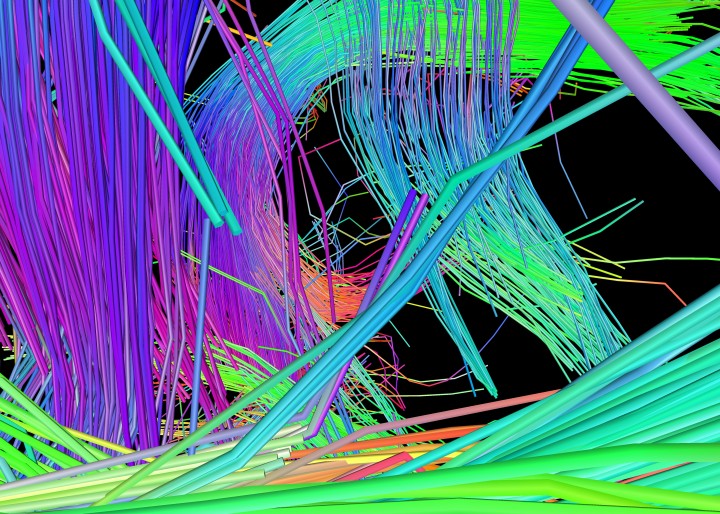
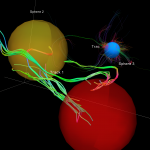
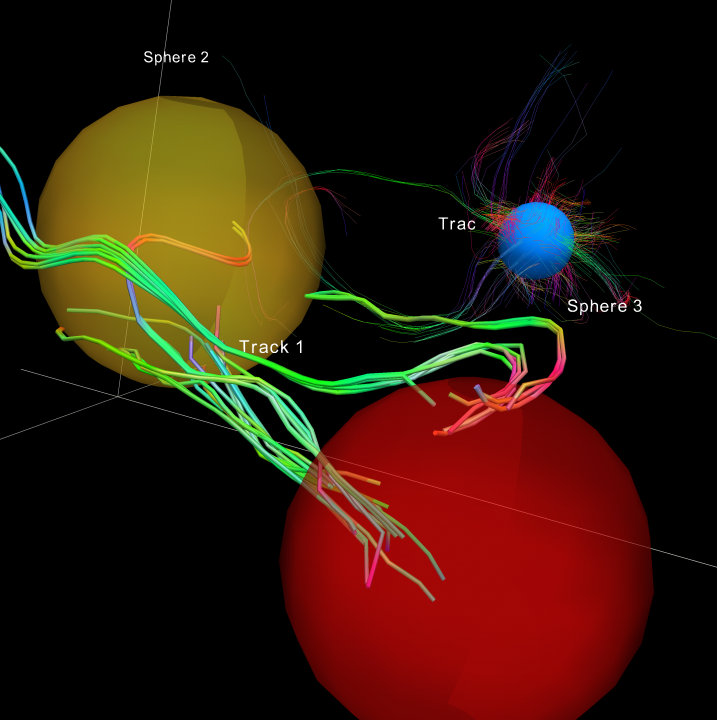
Select white matter tracts that run through spherical Regions of Interest (ROIs). Measured from diffusion spectral imaging (DSI). The fibers are color-coded by direction: red = left-right, green = anterior-posterior, blue = through brain stem. www.humanconnectomeproject.org Select white matter tracts that run through spherical Regions of Interest (ROIs). Measured from diffusion spectral imaging (DSI). The fibers are color-coded by direction: red = left-right, green = anterior-posterior, blue = through brain stem. www.humanconnectomeproject.org
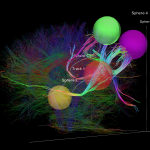
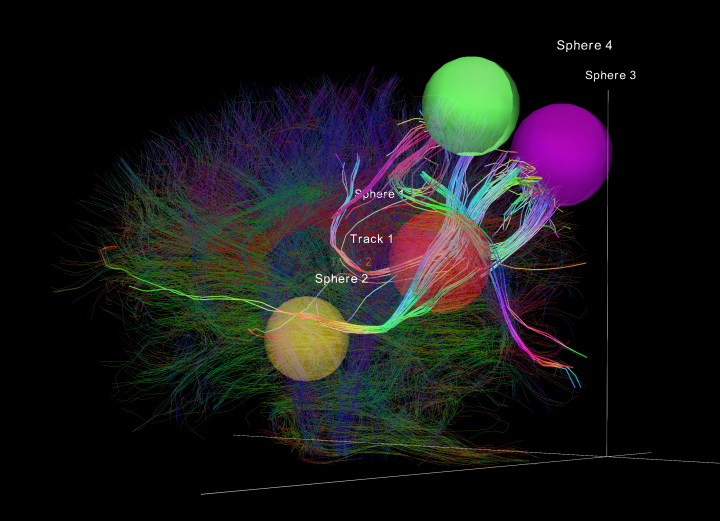
Select white matter tracts that run through spherical Regions of Interest (ROIs), superimposed over a larger amount of tracts from the same data set. Measured from diffusion spectral imaging (DSI). The fibers are color-coded by direction: red = left-right, green = anterior-posterior, blue = through brain stem. www.humanconnectomeproject.org Select white matter tracts that run through spherical Regions of Interest (ROIs), superimposed over a larger amount of tracts from the same data set. Measured from diffusion spectral imaging (DSI). The fibers are color-coded by direction: red = left-right, green = anterior-posterior, blue = through brain stem. www.humanconnectomeproject.org